
Why ChatGPT + Sheet Ninja?
ChatGPT can write a complete, working web app directly in the chat interface. Describe what you want, get a file, open it in your browser. It is one of the most underrated ways to build useful tools fast.
The usual path to building an analytics dashboard means either paying for a BI platform (Tableau, Looker, Power BI) or having a developer build something custom. Both take time and money you might not have for a team that just wants to understand its own data.
Sheet Ninja makes the connection simple. Your data is logged in Google Sheets - and it appears on the dashboard immediately. So now everyone can see the stats on screen in the room.
The use case
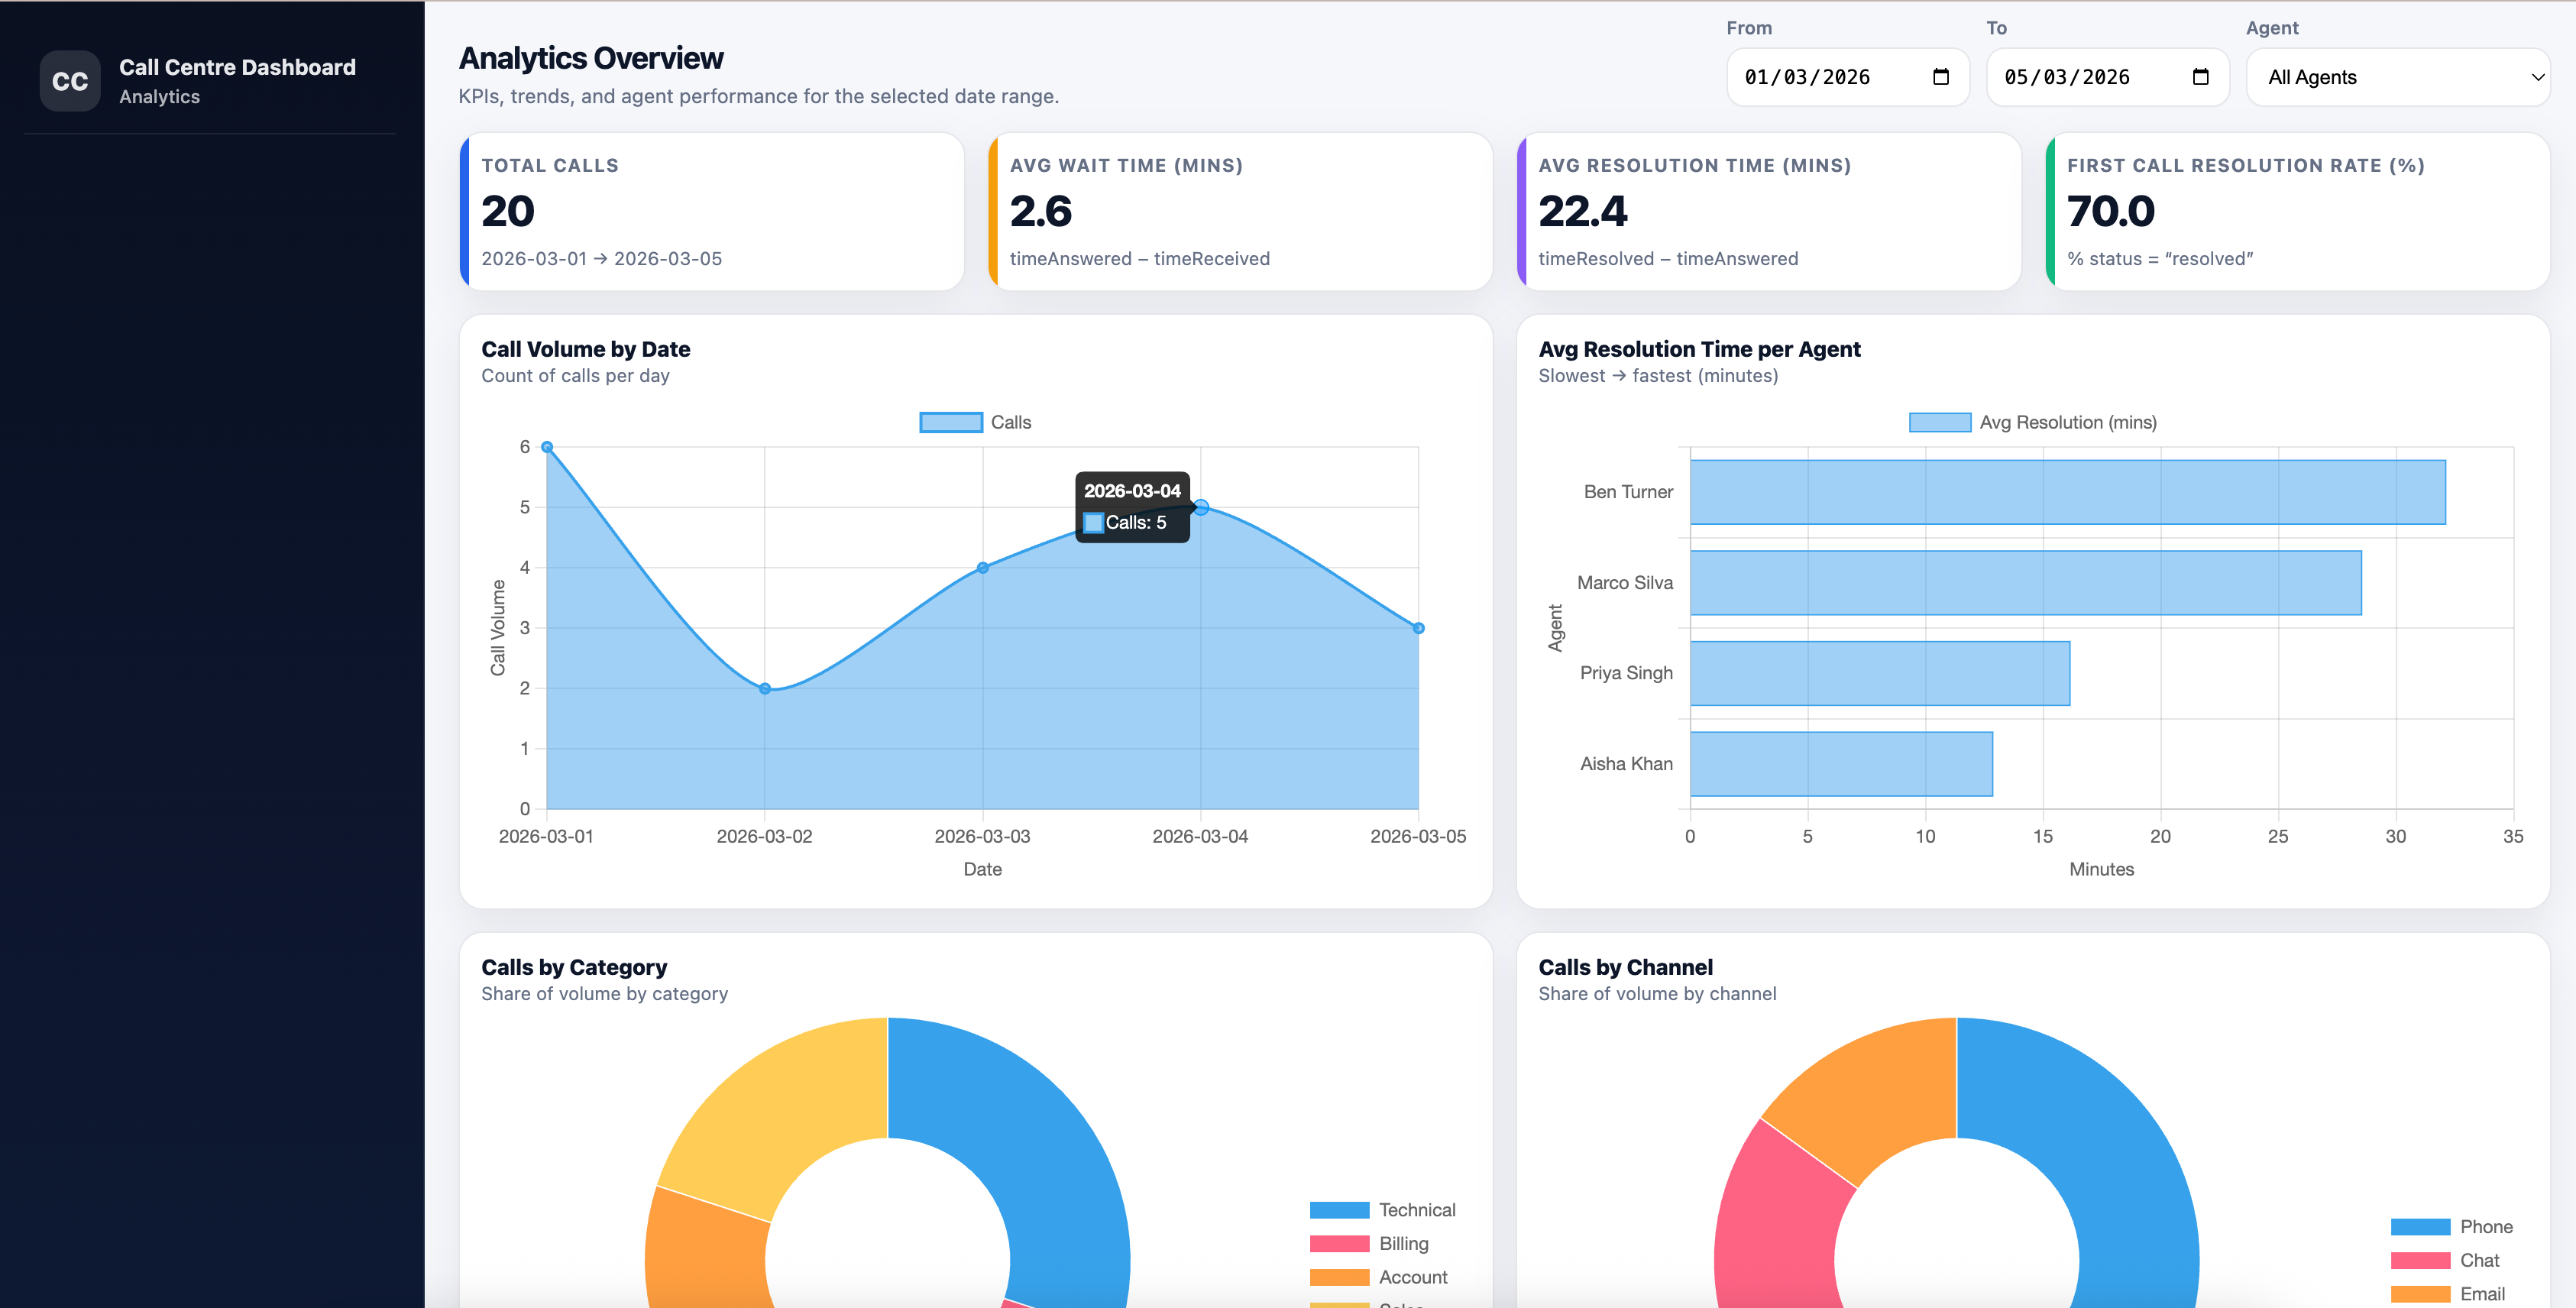
A call centre manager wants to see how the team is performing. Average wait time. Average resolution time. First call resolution rate. Which agents are handling calls fastest. Which categories are generating the most volume.
Right now that analysis means either exporting to Excel and building pivot tables by hand, or paying for software the team barely uses. This dashboard does it automatically, every time it loads, from the data the team is already collecting.
Here’s how:
1. Set up your Google Sheet
Create a new Google Sheet and add these column headers in Row 1 and some sample data:
| agent_name | date | time_received | time_answered | time_resolved | status | category | channel | notes |
|---|---|---|---|---|---|---|---|---|
| Ben Turner | 2026-03-01 | 09:11:22 | 09:13:10 | 09:41:55 | escalated | Technical | Phone | Router troubleshooting, escalated to L2 |
A few notes on the columns: if you wanted to, you can do complex calculations in the sheet (as you would normally do). E.g. Average wait time, or resolution time.
2. Create your Sheet Ninja API
Then go to sheetninja.io, connect your Sheet, and copy your API endpoint URL. Here’s the Quickstart guide if you need a reminder. That’s everything the dashboard needs.
2. Build it in ChatGPT
Open a new ChatGPT chat and paste this prompt:
1Build a call centre analytics dashboard as a self-contained HTML file.
2
3Here is everything you need:
4
5--- DOCS ---
6API reference: https://docs.sheetninja.io
7
8--- DATA ---
9- The data lives in a Google Sheet connected via Sheet Ninja. My Sheet Ninja base URL is: YOUR_ENDPOINT.
10- The sheet has these columns: agent_name, date, time_received, time_answered, time_resolved, status, category, channel, notes
11
12--- METRICS TO CALCULATE ---
13- Average wait time: time_answered minus time_received (in minutes)
14- Average resolution time: time_resolved minus time_answered (in minutes)
15- First call resolution rate: percentage of rows where status is "resolved" (vs "escalated" or "callback")
16- Total call volume for the selected date range
17
18--- DASHBOARD LAYOUT ---
19Top row — four KPI cards:
201. Total Calls
212. Avg Wait Time (mins)
223. Avg Resolution Time (mins)
234. First Call Resolution Rate (%)
24
25Charts row:
26- Line chart: call volume by date
27- Bar chart: average resolution time per agent (sorted slowest to fastest)
28
29Second charts row:
30- Doughnut chart: call breakdown by category
31- Doughnut chart: call breakdown by channel
32
33Agent table at the bottom:
34Columns: Agent Name | Total Calls | Avg Wait (mins) | Avg Resolution (mins) | FCR %
35Sorted by FCR % descending
36
37--- FILTERS ---
38- Date range picker (from / to) at the top — all charts and the table update when the range changes
39- Agent dropdown to filter to a single agent (or "All Agents")
40
41--- TECHNICAL ---
42- Use Chart.js for all charts (load from CDN)
43- Everything in a single HTML file — no external files, no build step
44- Fetch data from Sheet Ninja on page load. Refresh every 30 seconds.
45- Show a loading spinner while data is being fetched
46- Show a friendly error message if the fetch fails
47- If there is no data for the selected range, show an empty state per chart
48
49--- DESIGN ---
50- Clean, professional look — dark sidebar, white content area
51- KPI cards have a subtle coloured left border (different colour per metric)
52- Charts have clear axis labels and a legend
53- Agent table has alternating row colours and is easy to scan
54- Fully functional by just opening the HTML file in a browser
Replace YOUR_ENDPOINT with your Sheet Ninja URL and send. ChatGPT generates a single dashboard.html file. Download it, open it in a browser, and your dashboard is live.
What you get
A dynamic dashboard that refreshes every 30 seconds and is connected to your Google Sheets.
Why Google Sheets?
Most teams are already logging data somewhere - often a spreadsheet shared via Google Drive. Sheet Ninja just turns that spreadsheet into an API the dashboard can read. No migration, no new system, no retraining.
When the manager wants to add a new category or a new agent, they update the Sheet. The dashboard picks it up on the next load. When they want to export the underlying data, they already have it - it’s right there in the Sheet.
And because the dashboard is a single HTML file, it goes anywhere. Email it to the team. Drop it in a shared Drive folder. Pin it as a browser bookmark. No hosting, no subscription, no IT ticket required.